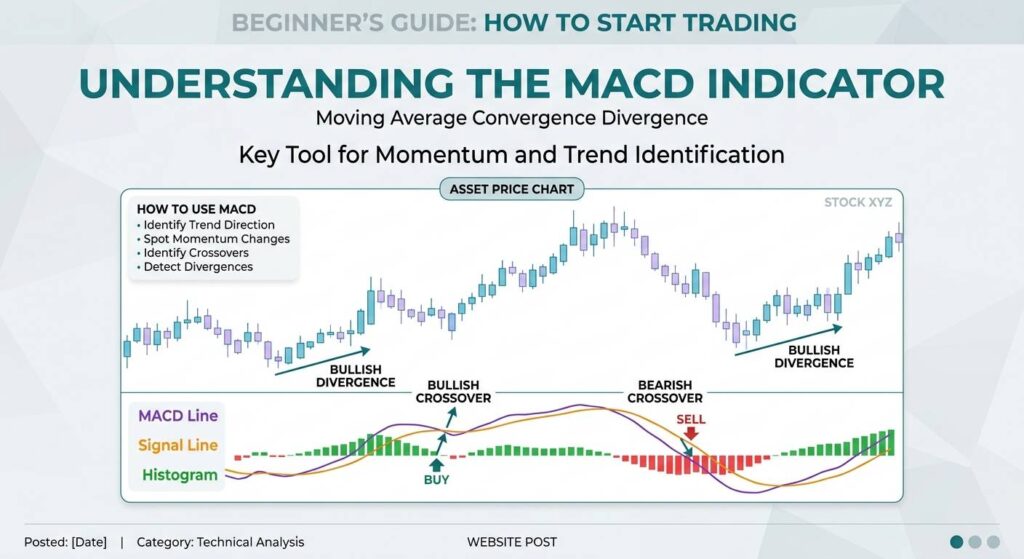
The MACD (Moving Average Convergence Divergence) is one of the most widely used momentum indicators in technical analysis. It helps traders understand trend direction, momentum, and potential changes in price movement.
Unlike an indicator that simply tells you whether price is going up or down, MACD indicator focuses on how strongly momentum is changing. This makes it useful for spotting potential trend continuations, crossovers, and momentum shifts.
What is MACD?
MACD compares two Exponential Moving Averages (EMAs):
MACD Line = 12-period EMA − 26-period EMA
A 9-period EMA of the MACD Line is then used as the Signal Line.
The indicator also includes a Histogram, which shows the difference between the MACD Line and Signal Line.
In simple terms:
- MACD Line → measures the difference between the short-term and longer-term EMA.
- Signal Line → smooths the MACD and helps identify crossovers.
- Histogram → shows the distance between the MACD and Signal Line.
- Zero Line → provides additional context about bullish or bearish momentum.
How Does MACD Work?
The basic idea is simple: when the short-term EMA moves faster than the long-term EMA, momentum is generally becoming stronger in that direction.
For example, if the 12-period EMA rises above the 26-period EMA, the MACD moves above zero. This indicates that recent price momentum is stronger than the longer-term trend.
When the opposite happens, MACD can move below zero, indicating weaker momentum.
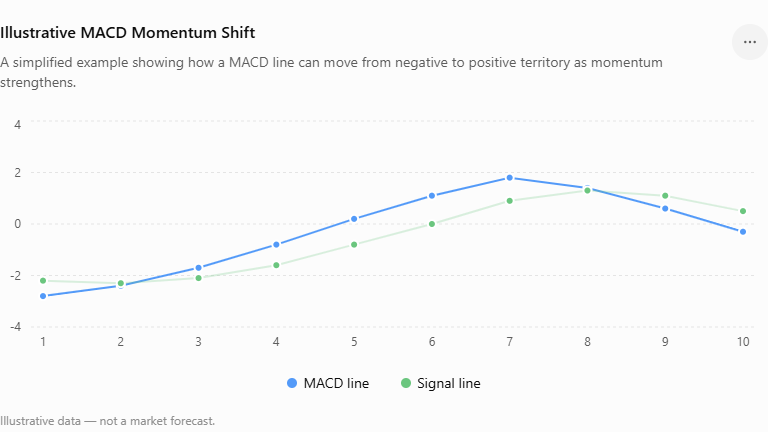
A simplified example showing how a MACD line can move from negative to positive territory as momentum strengthens.MACD lineSignal line-4-202412345678910
Illustrative data — not a market forecast.
1. MACD Crossovers
One of the most common ways traders interpret MACD is through crossovers.
Bullish crossover:
When the MACD Line crosses above the Signal Line, it can indicate that bullish momentum is strengthening.
Bearish crossover:
When the MACD Line crosses below the Signal Line, it can indicate that bearish momentum is strengthening.
However, a crossover is not a guaranteed buy or sell signal. In sideways or highly volatile markets, MACD can produce false signals. Traders often combine it with price structure, trend direction, support and resistance, or other forms of confirmation.
2. The Zero Line
The zero line provides another important layer of information.
When MACD is above zero, the shorter-term EMA is above the longer-term EMA, generally reflecting stronger bullish momentum.
When MACD is below zero, the shorter-term EMA is below the longer-term EMA, generally reflecting stronger bearish momentum.
A crossover occurring above or below the zero line can therefore provide different context than a crossover occurring near the zero line.
3. Understanding the MACD Histogram
The MACD histogram represents the difference between the MACD Line and Signal Line.
When the histogram expands upward, the gap between the two lines is increasing, suggesting strengthening bullish momentum.
When it expands downward, bearish momentum may be increasing.
When the histogram begins shrinking, momentum may be losing strength, even if price is still moving in the same direction.
This is one reason the histogram can be useful: it may highlight a change in momentum before a more obvious crossover occurs.
4. MACD Divergence
Another important concept is divergence.
A bearish divergence can occur when price makes a higher high while MACD forms a lower high. This suggests that upward momentum may be weakening.
A bullish divergence can occur when price makes a lower low while MACD forms a higher low. This suggests that downward momentum may be losing strength.
Divergence should be treated as a warning of possible momentum change, not as proof that a reversal will happen.
Why Traders Use MACD
MACD can help answer three practical questions:
1. What is the momentum doing?
Is bullish or bearish momentum strengthening or weakening?
2. Is momentum changing?
Crossovers and histogram changes can highlight shifts.
3. Does price movement have confirmation from momentum?
MACD can be compared with price action to identify potential divergence or confirmation.
A Simple Example
Imagine a stock has been falling for several weeks. The price then begins stabilizing.
The MACD Line starts rising, crosses above the Signal Line, and the histogram changes from negative toward positive.
This does not automatically mean the stock will rise. Instead, it tells the trader that downward momentum may be weakening and bullish momentum may be developing.
The trader can then look for additional confirmation from price action, trend structure, volume, or important support and resistance levels.
MACD Settings
The traditional MACD setup is:
| Component | Common Setting |
|---|---|
| Fast EMA | 12 |
| Slow EMA | 26 |
| Signal EMA | 9 |
These settings are widely used, but traders sometimes adjust them depending on their strategy and timeframe. Changing the settings can make MACD more or less sensitive to price movements.
The Key Takeaway
MACD is best understood as a momentum and trend-analysis tool—not a prediction machine.
Its real value comes from reading the relationship between the MACD Line, Signal Line, Histogram, Zero Line, and price action.
A strong trading analysis does not rely on one crossover alone. Instead, MACD can be used alongside market structure, support and resistance, price action, volume, and disciplined risk management.
Remember: MACD can help you understand what momentum is doing, but it cannot guarantee what price will do next.