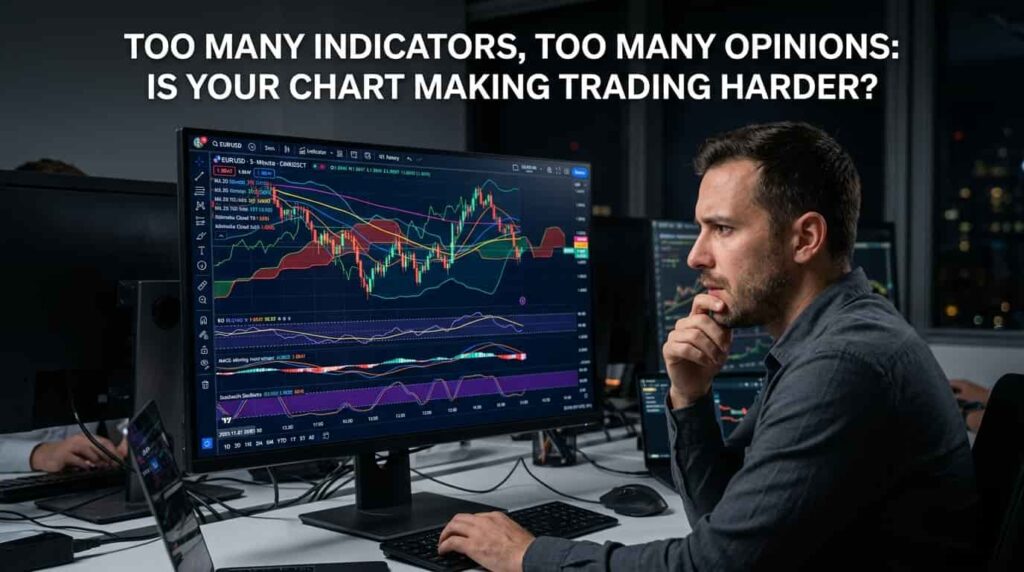
Have you ever opened a trading chart and found it covered with moving averages, RSI, MACD, Bollinger Bands, and several other indicators? At first, the chart may look professional. You might feel that every additional tool gives you another advantage.
But then something confusing happens.
Your RSI suggests the market is oversold, your moving averages point downward, and your MACD begins showing a possible bullish crossover. One indicator suggests buying, another suggests selling, and suddenly you are no longer sure what to do.
This is a common problem among traders. Instead of making decisions easier, too many indicators can create hesitation, conflicting signals, and unnecessary trades.
The real question is not how many indicators you use. It is whether each one helps you make a better trading decision.
Why Do Traders Keep Adding More Indicators?
Many traders start with a simple strategy. They learn support and resistance, identify a trend, and look for suitable entry points.
After a few losing trades, doubt begins to grow.
They start searching for a better indicator, a more accurate signal, or a strategy that promises fewer losses. They add another tool to their chart, hoping it will prevent the next mistake.
When that indicator also produces a losing signal, they add another one.
Over time, their trading setup becomes increasingly complicated.
This behavior is understandable. Nobody enjoys losing money, and traders naturally look for ways to improve their results. However, adding more indicators does not automatically improve a strategy. Sometimes it simply makes the decision-making process harder.
How Too Many Trading Indicators Create Confusion
1. Different Indicators Can Give Conflicting Signals
Imagine you are analyzing EUR/USD on a 15-minute chart.
The price is moving downward, but the RSI has entered oversold territory. At the same time, the MACD shows a possible bullish crossover.
Should you buy because the market looks oversold, or sell because the broader price movement remains bearish?
There is no automatic answer.
An oversold RSI does not guarantee that the price will reverse. A bullish MACD crossover does not guarantee that a new uptrend will begin. The market can remain bearish even when some indicators suggest a potential recovery.
If you rely on every signal equally, you may find yourself changing your opinion every few minutes.
A better approach: Decide what conditions must be present before entering a trade. Use indicators to support that plan rather than allowing every new signal to change it.
2. More Indicators Do Not Always Mean More Confirmation
One of the biggest misconceptions in technical analysis is that five indicators agreeing with each other must be more reliable than two.
However, many popular indicators use the same underlying price data.
For example, moving averages, MACD, and several trend-following tools are closely related to past price movements. When they point in the same direction, they may be reflecting similar information rather than providing three completely independent reasons to enter a trade.
This is why a chart full of matching signals can still produce a losing trade.
Confirmation can be useful, but the quality of that confirmation matters more than the number of indicators displaying it.
3. You May Enter Trades Too Late
Indicators often process past price data. Some respond quickly to price changes, while others require more confirmation before changing direction.
When you wait for several indicators to agree, the market may already have moved significantly.
For example, a trader notices a bullish breakout near a resistance level. The price begins moving upward, but the trader waits for the moving average, RSI, and MACD to confirm the move.
By the time every signal aligns, the entry may be much farther from the original breakout level.
The trader might then place a stop loss that is too wide, accept a poor risk-to-reward ratio, or chase the market out of fear of missing the move.
Waiting for confirmation is not necessarily wrong. The problem is demanding so many confirmations that the original opportunity no longer offers an attractive trade.
4. Indicators Can Become an Excuse to Ignore the Price Chart
Price action is the foundation of most technical indicators. Yet traders sometimes become so focused on indicator readings that they stop paying attention to the market itself.
They may overlook a major resistance level, a strong rejection candle, a developing trading range, or a nearby support zone because their favorite indicator still suggests a buy.
Indicators provide useful information, but they do not remove the need to understand market structure and context.
A signal that works well in a strong trend may perform poorly in a sideways market. The same indicator can produce very different results under different conditions.
A Realistic Example: Two Traders, One Market
Consider two traders analyzing the same currency pair. Both are looking for a potential buying opportunity.
| Trading decision | Trader A: Indicator-heavy | Trader B: Rule-based |
|---|---|---|
| Chart setup | Six indicators | Price structure and one or two selected tools |
| Market analysis | Waits for several signals to agree | Checks trend, key levels, and entry conditions |
| Conflicting signals | Frequently changes direction | Follows predefined rules |
| Risk management | May hesitate or chase an entry | Defines risk before entering |
| Main weakness | Information overload | Can still misread the market |
Trader B does not automatically become the better trader simply by using fewer indicators. Trader A may also have a profitable strategy built around multiple indicators.
The important difference is whether the tools have a clear purpose and whether the trading rules have been tested.
A simple strategy can lose money, and a complex strategy can make money. Neither chart design guarantees profitability.
The goal is to build a process that you understand, can execute consistently, and can evaluate using actual trading results.
How Many Indicators Should You Use?
There is no universally correct number. Some traders use none, while others use several as part of a systematic strategy.
For many retail traders, however, starting with a small number of complementary tools is easier to manage than using a crowded chart.
Here is one practical way to organize your analysis:
1. Market structure
Identify whether the market is trending upward, trending downward, or moving sideways. Mark relevant support and resistance levels.
2. One trend tool
If it suits your strategy, use a moving average to help assess trend direction. Remember that it is based on historical prices and can lag.
3. One momentum tool
You might use RSI or MACD to assess momentum. You do not necessarily need both, especially if they are giving you overlapping information.
4. Risk management
Before entering a trade, identify where your setup becomes invalid, calculate your position size, and determine whether the potential reward justifies the risk.
Risk management is not another indicator. It is a core part of the trading plan.
How to Simplify Your Trading Chart Without Losing Useful Information
If your chart feels confusing, you do not need to remove every indicator overnight. Instead, review your setup methodically.
Step 1: Give Every Indicator a Specific Job
Ask yourself what each tool actually tells you.
Does it help identify the trend? Measure momentum? Assess volatility? Or does it simply repeat information already available elsewhere?
If you cannot explain why an indicator is on your chart, consider removing it during your strategy review.
Step 2: Stop Changing Your Setup After Every Loss
A losing trade does not automatically mean your strategy is broken.
Even a well-tested trading strategy can experience losing streaks. Adding or removing indicators after every loss can prevent you from collecting enough consistent data to understand whether your approach has an edge.
Review a meaningful sample of trades before making major changes. The appropriate sample size depends on your strategy, trade frequency, and market conditions.
Step 3: Test Your Rules
Use historical data or a demo account to assess your setup. Record your entries, exits, risk, market conditions, and results.
Compare your original strategy with any proposed changes. Include realistic spreads, commissions, and slippage where relevant.
Do not judge a strategy by a handful of successful trades. Look for consistent evidence across different conditions, and remember that historical performance does not guarantee future results.
Step 4: Create a Pre-Trade Checklist
Before placing an order, ask:
- Is the market trending or ranging?
- Is my setup present according to my written rules?
- Am I entering near a meaningful level or chasing a move?
- Where will I exit if the trade goes against me?
- Is my position size appropriate for my risk limit?
- Am I taking this trade because of my plan or because I fear missing out?
If your answers are unclear, waiting can be a valid decision.
Can You Trade Profitably Without Indicators?
Yes, it is possible. Some traders rely mainly on price action, support and resistance, market structure, and risk management.
Others use indicators as an important part of their strategies.
Neither approach is automatically superior. What matters is whether the method fits the trader, has been tested properly, and can be followed consistently.
Indicators are tools, not predictions. They summarize aspects of market data, but they cannot tell you with certainty what price will do next.
Removing indicators will not fix poor risk management, emotional decision-making, or a strategy without a demonstrated edge. Similarly, adding indicators cannot guarantee that those problems will disappear.
Final Thoughts: Make Your Chart Work for You
A crowded chart can create the illusion of control. Every new line or signal may feel like another layer of protection against losing trades.
But financial markets do not become predictable simply because a chart contains more information.
The most useful setup is one that helps you identify opportunities, understand when your trading idea is invalid, and manage risk without unnecessary hesitation.
Review your current indicators. Keep the ones that serve a clear purpose, test any changes carefully, and stop treating every new signal as a reason to change your mind.
You do not need the busiest chart in the market. You need a trading process you can explain, test, and follow.
Disclaimer: This article is for educational purposes only and does not constitute financial or investment advice. Trading forex, CFDs, and other leveraged products involves significant risk, including the potential loss of your capital.