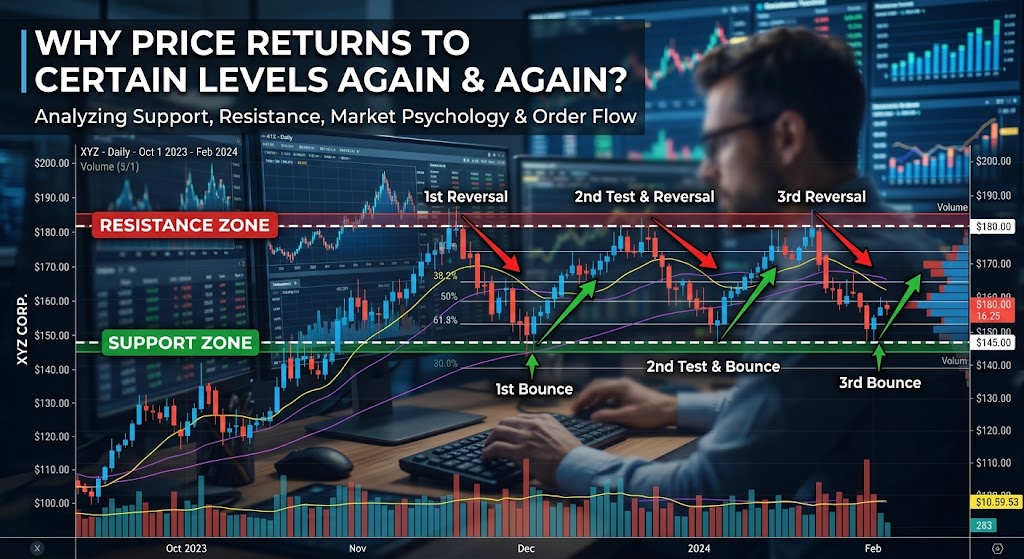
Why Price Returns to Certain Levels Again and Again is a question many traders encounter when they notice price repeatedly approaching the same highs, lows, or price zones. Although a market does not literally “remember” a price, certain areas can attract attention because they are connected to previous trading activity, expectations, and decisions made by market participants. Understanding why these areas matter can make a chart easier to read without assuming that every return will produce a reversal.
A Price Level Is More Than a Number
A price such as $100 may look completely ordinary on its own. But if an asset previously moved sharply away from $100, that price can become a reference point for traders.
When price returns, different participants may react differently:
- Some traders may close existing positions.
- Others may look for a new entry.
- Some may watch for a breakout.
- Others may expect another rejection.
This combination can make a previously important area active again.
The important point is that the price itself does not cause the reaction. It is the behavior of market participants around that price that makes the area interesting.
Why Previous Highs and Lows Matter
Previous highs and lows are among the most visible reference points on a chart.
Imagine an asset reaches $105 and then falls to $95. Several hours later, it begins climbing toward $105 again.
The second visit is different from the first.
Now traders can see what happened at $105 previously. The old high has become a reference point where buying and selling decisions may increase.
This does not mean $105 must stop the market.
It simply means the area deserves attention.
Price Levels Are Usually Zones
One of the biggest mistakes beginners make is treating support and resistance as perfectly precise lines.
Real price movement is rarely that clean.
Instead of thinking:
“$100 is resistance.”
It can be more useful to think:
“The area around $100 has previously attracted selling interest.”
Price might reach $99.70, move to $100.30, briefly trade above $100, and then reverse.
If you were watching only one exact line, that movement might look like the level “failed.”
If you were watching a zone, the behavior makes much more sense.
The Retest Tells a New Story
A particularly interesting situation occurs when price breaks through an old level and later returns.
Suppose resistance existed around $100.
Price moves from $98 to $103 and breaks above the area.
Later, it falls back toward $100.
Now traders are watching a retest.
The old resistance area may potentially behave as support, although there is no guarantee that it will.
This creates an important difference between:
First visit: What happened here before?
Retest: What is happening here after the market has already moved through it?
The second question can provide additional information about current market behavior.
Why Price Can Move Through a Level
A common misconception is that a support or resistance area should always produce an immediate reversal.
Markets do not work that way.
A level can be:
- respected;
- temporarily broken;
- repeatedly tested;
- completely broken;
- broken and later reclaimed.
For example, price might move above an old high, attract additional buying, and continue higher.
Alternatively, price might briefly trade above the high and then fall back below it.
The same price area can therefore produce completely different outcomes under different market conditions.
Look at the Reaction, Not Just the Level
A horizontal line gives you a location.
The reaction gives you information.
Suppose price reaches an old high.
Situation 1: Immediate rejection
Price reaches the area and quickly falls.
Situation 2: Repeated testing
Price reaches the area several times but continues to hold nearby.
Situation 3: Strong breakout
Price moves through the area and remains above it.
These three situations should not be treated as identical.
The level is the same.
The market’s response is different.
That is why experienced chart analysis often focuses on what price does around an important area rather than assuming what it must do.
The Role of Liquidity
Liquidity is another reason traders pay attention to previous highs and lows.
In simple terms, liquidity refers to the ability to buy or sell without causing excessive price movement. Market participants also place different types of orders around prices they consider important.
Previous highs and lows can therefore become areas where trading activity deserves closer observation.
However, traders should be careful with the popular claim that every previous high or low contains a guaranteed collection of stop-loss orders.
Order placement varies between traders and markets, and the actual order book is not necessarily visible from a normal price chart.
So rather than assuming:
“There are definitely stop orders above this high,”
a more accurate approach is:
“This visible high is an important reference point, so I should watch how price behaves around it.”
Why Round Numbers Get Attention
Round numbers can also become psychologically noticeable.
Examples include:
- 100
- 1,000
- 10,000
- 50,000
These numbers are easy to remember and can become common reference points.
But round numbers should not automatically be treated as support or resistance.
Their importance depends on the market and the behavior occurring around them.
A round number with no meaningful price reaction is simply a number.
Market Context Changes Everything
The same price level can behave differently depending on the surrounding market.
Imagine resistance at $100.
If the market has been steadily rising, price may eventually break through it.
If momentum has weakened, the same area might produce a rejection.
If the market is moving sideways, price could repeatedly move between the level and another nearby zone.
This is why a level should never be analyzed completely on its own.
Look at:
Trend + volatility + recent price behavior + reaction around the level
rather than relying on the horizontal line alone.
A Better Way to Mark Levels
Instead of filling a chart with dozens of lines, focus on areas that have clear evidence behind them.
Look for:
- Previous major highs
- Previous major lows
- Areas where price changed direction sharply
- Strong breakout points
- Levels that were later retested
- Zones repeatedly tested by price
Then ask:
What happened the last time price was here?
And more importantly:
What is happening this time?
That second question keeps your analysis focused on current market behavior rather than assuming history must repeat.
The Market Does Not Have a Memory
This is perhaps the most important idea.
Price does not “remember” that it was rejected at $100 last week.
There is no invisible force telling the market:
“Stop at $100 again.”
Instead, traders and institutions continuously make decisions based on available information, positions, expectations, risk, and market conditions.
Previous prices become references.
Those references can influence behavior.
That is why a level can matter without having magical predictive power.
Final Takeaway
Why Price Returns to Certain Levels Again and Again becomes easier to understand when you stop thinking of price levels as magical lines.
Previous highs, lows, breakout areas, and other recognizable zones can attract attention because traders use them as references when making decisions.
But a level does not guarantee a reversal.
The real information appears when price reaches the area again.
Does it reject?
Does it consolidate?
Does it repeatedly test the zone?
Does it break through and hold?
The level tells you where to pay attention.
The reaction tells you what the market is doing there.
That distinction can turn a simple horizontal line into a much more useful part of technical analysis.