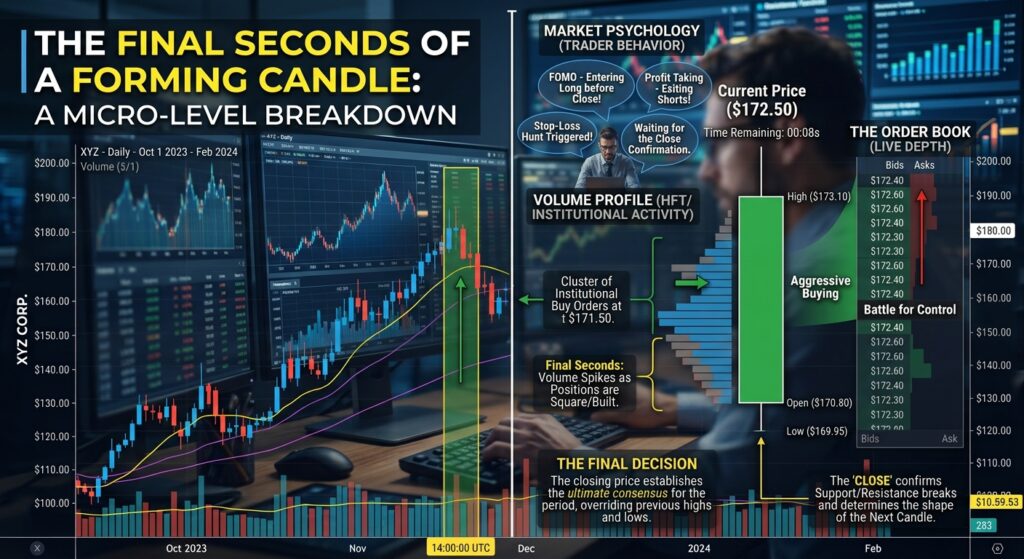
What Happens Inside a Candle Before It Closes? is more interesting than simply asking whether a candle is bullish or bearish. Before a candle becomes a finished record of its open, high, low, and close, price can move sharply in several directions, creating a completely different final shape. Understanding this developing process helps traders distinguish between what a candle is showing right now and what it actually records once the period has ended.
A Candle Is a Compressed Story
A completed candlestick looks simple.
It shows four basic pieces of information:
- Open
- High
- Low
- Close
But these four numbers represent an entire period of price movement.
Consider a five-minute candle.
It opens at:
$100
During the next few minutes, price moves to:
$101 → $103 → $102 → $104
Then sellers enter and price falls back to:
$101.50
The five-minute period ends there.
The final candle does not show every step.
It simply records:
Open: $100
High: $104
Low: $100
Close: $101.50
A complicated sequence has been compressed into one visual object.
The Candle Is Still Changing Before It Closes
This is where many new traders make mistakes.
Suppose a bullish candle is halfway through its timeframe and has a large green body.
A trader may immediately interpret it as a strong bullish signal.
But the candle is unfinished.
Price could continue higher.
Or it could reverse.
Or it could completely erase the current body.
An unfinished candle is therefore temporary information.
Its final appearance cannot be known until its timeframe ends.
The Candle You See Is Not the Whole Story
Imagine a candle that eventually closes near its opening price.
Looking only at the finished candle might make the period appear relatively quiet.
But suppose price actually moved:
$100 → $105 → $98 → $100.20
That was not a quiet period.
Price traveled through a wide range before returning close to where it started.
The final candle compresses all of that movement into a body and two wicks.
This is why the range can sometimes tell a different story from the candle body.
What the Body Really Shows
The body represents the distance between the opening and closing prices.
A large body means the open and close were relatively far apart.
A small body means they were relatively close.
But body size alone does not tell you everything that happened.
Consider two candles:
Candle A
Open: $100
High: $103
Low: $99
Close: $102.80
Candle B
Open: $100
High: $110
Low: $90
Close: $100.20
Both may finish close to their starting prices.
But Candle B experienced a much larger range.
The body alone hides that difference.
Wicks Show Where Price Traveled
Wicks provide another layer of information.
The upper wick represents prices traded above the body.
The lower wick represents prices traded below the body.
For example:
Open: $100
High: $108
Low: $98
Close: $100.50
Price reached $108 but did not finish there.
It also reached $98 before returning upward.
This tells you that the market explored a much wider area than the small final body might suggest.
However, a wick should not automatically be interpreted as proof of a reversal.
A wick tells you where price traded.
The reason price moved there requires additional context.
Why an Unfinished Wick Can Disappear
This is one of the most useful things beginners can observe.
Imagine a five-minute candle moves rapidly upward.
At one point:
Open: $100
Current price: $106
A long upper wick may not exist yet because the candle is still trading near its current high.
Then price suddenly falls to $102 before the candle closes.
Now the finished candle may show a large upper wick.
But if price climbs back to $105 before the five minutes end, that wick becomes smaller.
The wick is therefore not fixed until the candle closes.
The Close Can Change the Entire Appearance
Consider a candle that opens at $100.
During the period, it reaches $106.
Then it falls to $98.
Finally, it closes at $105.
The finished candle tells you that price ended significantly above its opening level despite visiting much lower prices.
Now imagine another candle with:
Open: $100
High: $106
Low: $98
Close: $99
The high and low are identical.
Only the close is different.
Yet the two candles communicate very different information about where the market ended the period.
This is why the close deserves more attention than simply asking whether the candle touched a particular price.
A Candle Is Not a Prediction
Candlestick patterns are often presented as if they automatically predict what happens next.
That can be misleading.
A candle is primarily a record of price behavior during a defined period.
Its interpretation depends on context.
For example, a long upper wick near a previous high may be worth investigating.
The same wick in the middle of an uneventful range may have a completely different significance.
The candle provides evidence.
It does not provide certainty.
Timeframe Changes What You See
A candle’s timeframe determines how much price activity gets compressed into it.
One hourly candle can contain twelve five-minute candles.
Those smaller candles may show:
- an initial decline;
- a sharp recovery;
- a breakout;
- a pullback;
- another rally.
The one-hour chart may compress all of this into a single bullish candle.
Neither chart is necessarily contradicting the other.
They are simply showing different levels of detail.
This is why traders can sometimes see a strong bullish hourly candle while the five-minute chart looks extremely volatile.
Watch the Candle Before You Interpret It
Instead of immediately labeling an unfinished candle, observe its development.
For example:
Early stage
Where is price relative to the opening price?
Middle stage
Has the range expanded?
Is price moving toward the high, low, or back toward the open?
Late stage
Where is price finishing relative to the total range?
After the close
Now examine the completed candle.
This process separates observation from interpretation.
That distinction can reduce the temptation to react to every temporary movement.
The Most Interesting Question: Where Did Price Finish?
Suppose price travels from $100 to $105 and then back to $100.
The market visited $105.
But it did not finish there.
Now suppose it reaches $105 and closes at $104.80.
The same high produced a completely different ending.
This does not automatically tell you what will happen next.
But it gives you a clearer description of what happened during the completed period.
That is the real value of the candle.
Four Numbers Can Hide a Lot of Movement
OHLC data is powerful because it compresses information.
But compression also removes detail.
A candle cannot tell you every transaction that happened during its timeframe.
Two completely different intraperiod paths can produce very similar OHLC values.
For example:
Path A:
$100 → $103 → $101 → $104
Path B:
$100 → $97 → $101 → $104
Both could eventually produce the same:
Open = $100
High = $104
Close = $104
The candle alone does not reveal the exact route price took between those points.
That is a useful limitation to remember.
A Simple Exercise for Beginners
Open a chart and select a timeframe such as five minutes.
Watch one candle from its opening moment until it closes.
Write down:
Opening price
Highest price observed
Lowest price observed
Closing price
Then compare your observations with the completed candle.
Repeat this for several candles.
You will quickly see how dramatically a candle can change during its formation.
More importantly, you will start seeing candles as developing price stories rather than fixed signals.
Final Takeaway
What Happens Inside a Candle Before It Closes?
A lot more than the final shape reveals.
Price can move through several levels, create temporary highs and lows, reverse direction, expand its range, and completely change the candle’s appearance before the timeframe ends.
The open tells you where the period began.
The high and low show the extremes reached.
The close tells you where the period finished.
But the path between those four numbers is partly hidden.
That is why an unfinished candle should be treated differently from a completed one.
Don’t just ask:
“Is this candle bullish or bearish?”
Ask:
“Where has price traveled, where is it now, and where does it finally close?”
That small change in perspective can make candlestick analysis much more precise.